Playbook: Development of the P-shape profile
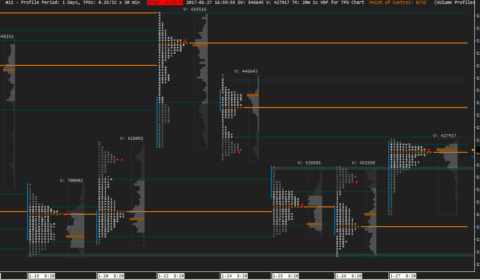
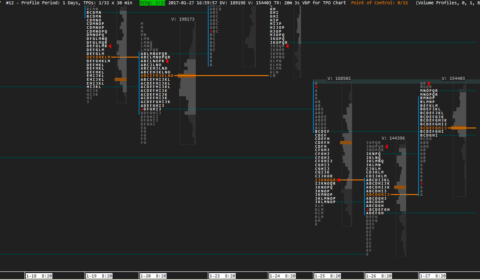
In this example, you can follow step-by-step the development process of a P-Shaped Market Profile (short-covering rally) in the US treasury futures markets (5yr Note – ZF and 30yr Bond ZB).
P-shaped profile – created by short-covering activity – usually follows one or more down trending day(s). It is characterized by long, thin, low-volume bottom half with a single-print buying tail while the upper half of the profile is wider and well developed/balanced.
The first part of the day can be incorrectly interpreted as aggressive other timeframe buying (sharp and aggressive rally), but really it is just part of a short-covering. After short covering is completed the upper half of the profile becomes neutralized and balanced. In this example, there was a strong news-related move in the first hour of the regular session.
“Short covering is caused by old business, not by new participants entering the market.” – Jim Dalton

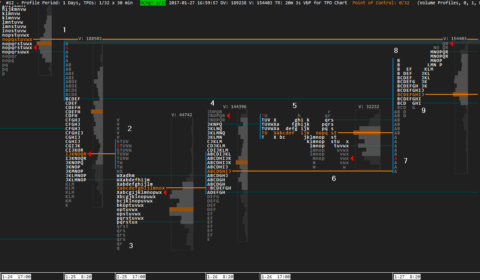
30yr Bonds ETH/RTH Split Profile
- 25th Jan: trend day – strong down open move right from the Globex POC and VPOC.
- Down move continued overnight with a strong rejection (selling tail) during period ‘V’.
- 28th Dec VAL support held and rejected the price at 149-00.
- 26th Jan Day session: price rejected again from the 149-00 VAL support then closed near the previous day session’s VPOC forming a poor high what provided resistance for the coming Globex and day session
- During the night session price retraced back several times from the previous poor high
- and was rejected from the previous day’s POC/VPOC (Double Bottom)
- 27th Jan: open inside the previous two day’s VA near the VAL/VPOC then strong news-driven up move right from the POC/VPOC during the first hour through the previous poor high.
- Rejection in period B at 25th Jan single print selling tail
- Balance built at the previous high/VAH then strong up-continuation to the 25th Jan open.
Last updated: December 8, 2023 at 18:17 pm
Uploads are powered by Proton Drive, MEGA, and Vultr.

